

Microwave circuits based on superconducting transmission lines can also be used to investigate electron transport through nanometer scale electronic devices based on single molecules or carbon nanotubes. By measuring the radiofrequency properties of such a circuit, the properties of the integrated device can be determined with a larger bandwidth and better signal-to-noise compared to DC measurements, allowing, for example, for measurements with microsecond or better time resolution.
We realized so-called stub tuners, which transform a target impedance, typically 12-100 kΩ, to 50 Ω at a resonance frequency in the GHz range [1]. The device consists of two transmission line sections, with the device placed at the end of one section, the other section terminating in an open end, as shown in Fig. 1 (a-c). We measure the microwave reflection coefficient, which depends both on the frequency and the resistance of the integrated device, expecting a coefficient of one for low device resistances and away from the resonance frequency and zero on resonance and at the target matched resistance.
To characterize the circuit, a thin gold wire, known as a break-junction was integrated and successively thinned by application of a current, leading to a variable resistance. Reflection spectra of the device at different resistances were taken. A resonance developed as the resistance increased, plotted in Fig. 1 (d). The relevant device parameters were extracted from a single spectrum and then used to predict the properties of the device. In particular, Fig.1 (e) shows a comparison of the measured reflection coefficient at resonance as a function of DC resistance (blue points) versus the predicted behavior (dashed line) based on the parameters extracted at 12 kΩ. It is further possible to extract the impedance of the gold wire at GHz frequencies from the spectra using these parameters. A comparison of the measured DC resistance and extracted RF impedance is shown in Fig. 1 (f), indicating that the DC resistance agrees well with the RF impedance of a break-junction at 6 GHz.
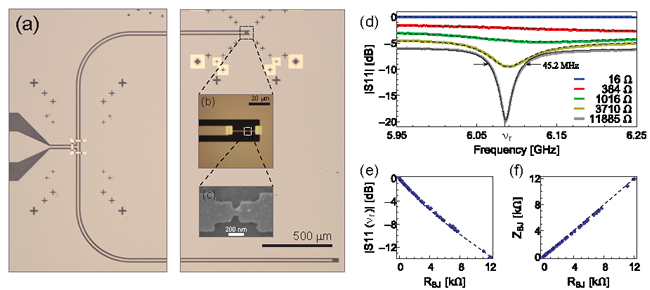
Figure 1: (a) Optical image of the sample, showing the input port (left hand side) and the two transmission lines. A break-junction is placed at the end of the upper line, an optical zoom is shown in (b) and an SEM image in (c).(d) Reflection spectra of an impedance matching circuit at different resistances of the break-junction. As the junction resistance increases, the resonance becomes more pronounced. (e) The reflection coefficient Γ as a function of break junction resistance (blue points), the dashed line is the predicted behavior based on the parameters extracted at 12 kΩ. (f) A comparison between the DC resistance and RF impedance of the break-junction.
Full article:
http://apl.aip.org/resource/1/applab/v101/i5/p053108_s1, also in arXiv:1207.4403
G. Puebla-Hellmann, A. Wallraff, Appl. Phys. Lett 101, 053108 (2012)