

The spatiotemporal measurement of electromagnetic fields is an important necessity in many branches of technology with more and more techniques being developed in recent years. For example, in experiments which examine quantum mechanics at the interface of atoms and micro-fabricated chips, its effects are not easy to observe because of uncontrollable stray fields emanating from the surface. For optimal field compensation, a thorough characterization of even small electric fields with high resolution on a mm-scale is necessary and has not been demonstrated so far.
In this article, we present a simple technique that measures static and microwave field distributions on a mm-scale and with a resolution of approximately 100 micrometer in the vicinity of a superconducting, chip-based microwave guide. Lines with the same specific field strength can be imaged in-situ by measuring the spatial distribution of atoms in states that are very sensitive to electric fields (Rydberg states). As applications we characterize the complete static stray-electric field (Fig. 1) and the distribution of the microwave field emanating from the chip surface.
The thorough characterization of stray fields will allow us to ultimately interface single atoms (in Rydberg states) with single microwave photons on a chip. Additionally it may allow to examine the interaction of these atoms with the surface or, technologically relevant, to identify spurious (microwave) fields in micro-fabricated chips. In principle, the simplicity of the setup allows an integration into completely different experiments as a characterization tool for electric fields
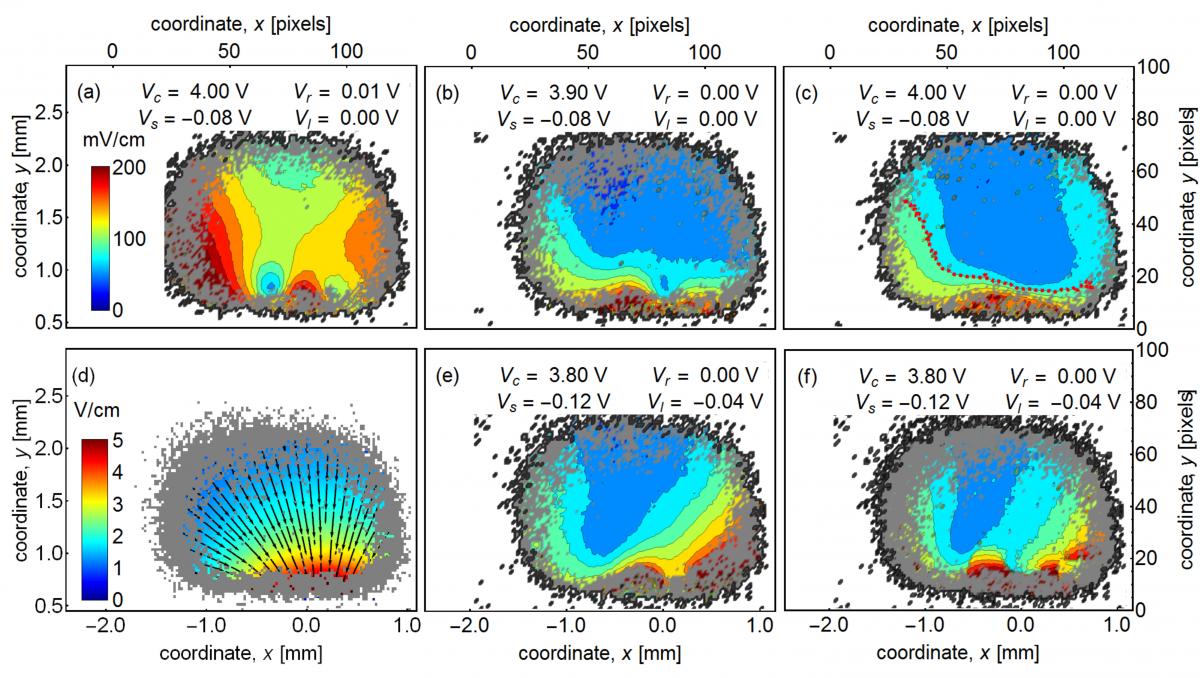
FIG. 1: (a-c) Distribution of stray-electric-field strengths extracted from Stark shifts measured for the potential configurations denoted in each panel. The dotted line in (c) indicates a region of well-compensated stray fields. (d) Electric-stray-field vectors extracted from measurements (a-c). (f) Predicted electric-field distribution as measured in panel (e). Except for panel (d) all color scales are identical to the color scale given in (a).
Full article: http://journals.aps.org/pra/abstract/10.1103/PhysRevA.92.063425, also in arXiv:1509.05450
T. Thiele, J. Deiglmayr, M. Stammeier, J. - A. Agner, H. Schmutz, F. Merkt, and A. Wallraff, Phys.Rev. A 92, 063425 (2015)